Imagine being a Formula One driver, racing at breakneck speeds, but without any telemetry data to guide you. It’s a thrilling ride, but one wrong turn or an overheating engine could lead to disaster. Just like a pit crew relies on performance metrics to optimize the car’s speed and handling, we rely on observability in ClickHouse to monitor the health of our data systems for storing and querying logs. These metrics provide crucial insights, allowing us to identify bottlenecks, prevent outages, and fine-tune performance, ensuring our data engine runs as smoothly and efficiently as a championship-winning race car.
In this blog, we’ll focus on performance benchmarking ClickHouse on AWS ECS in the context of log storage and querying, analyzing key system metrics like CPU usage, memory consumption, disk I/O, and row insertion rates across varying data ingestion volumes.
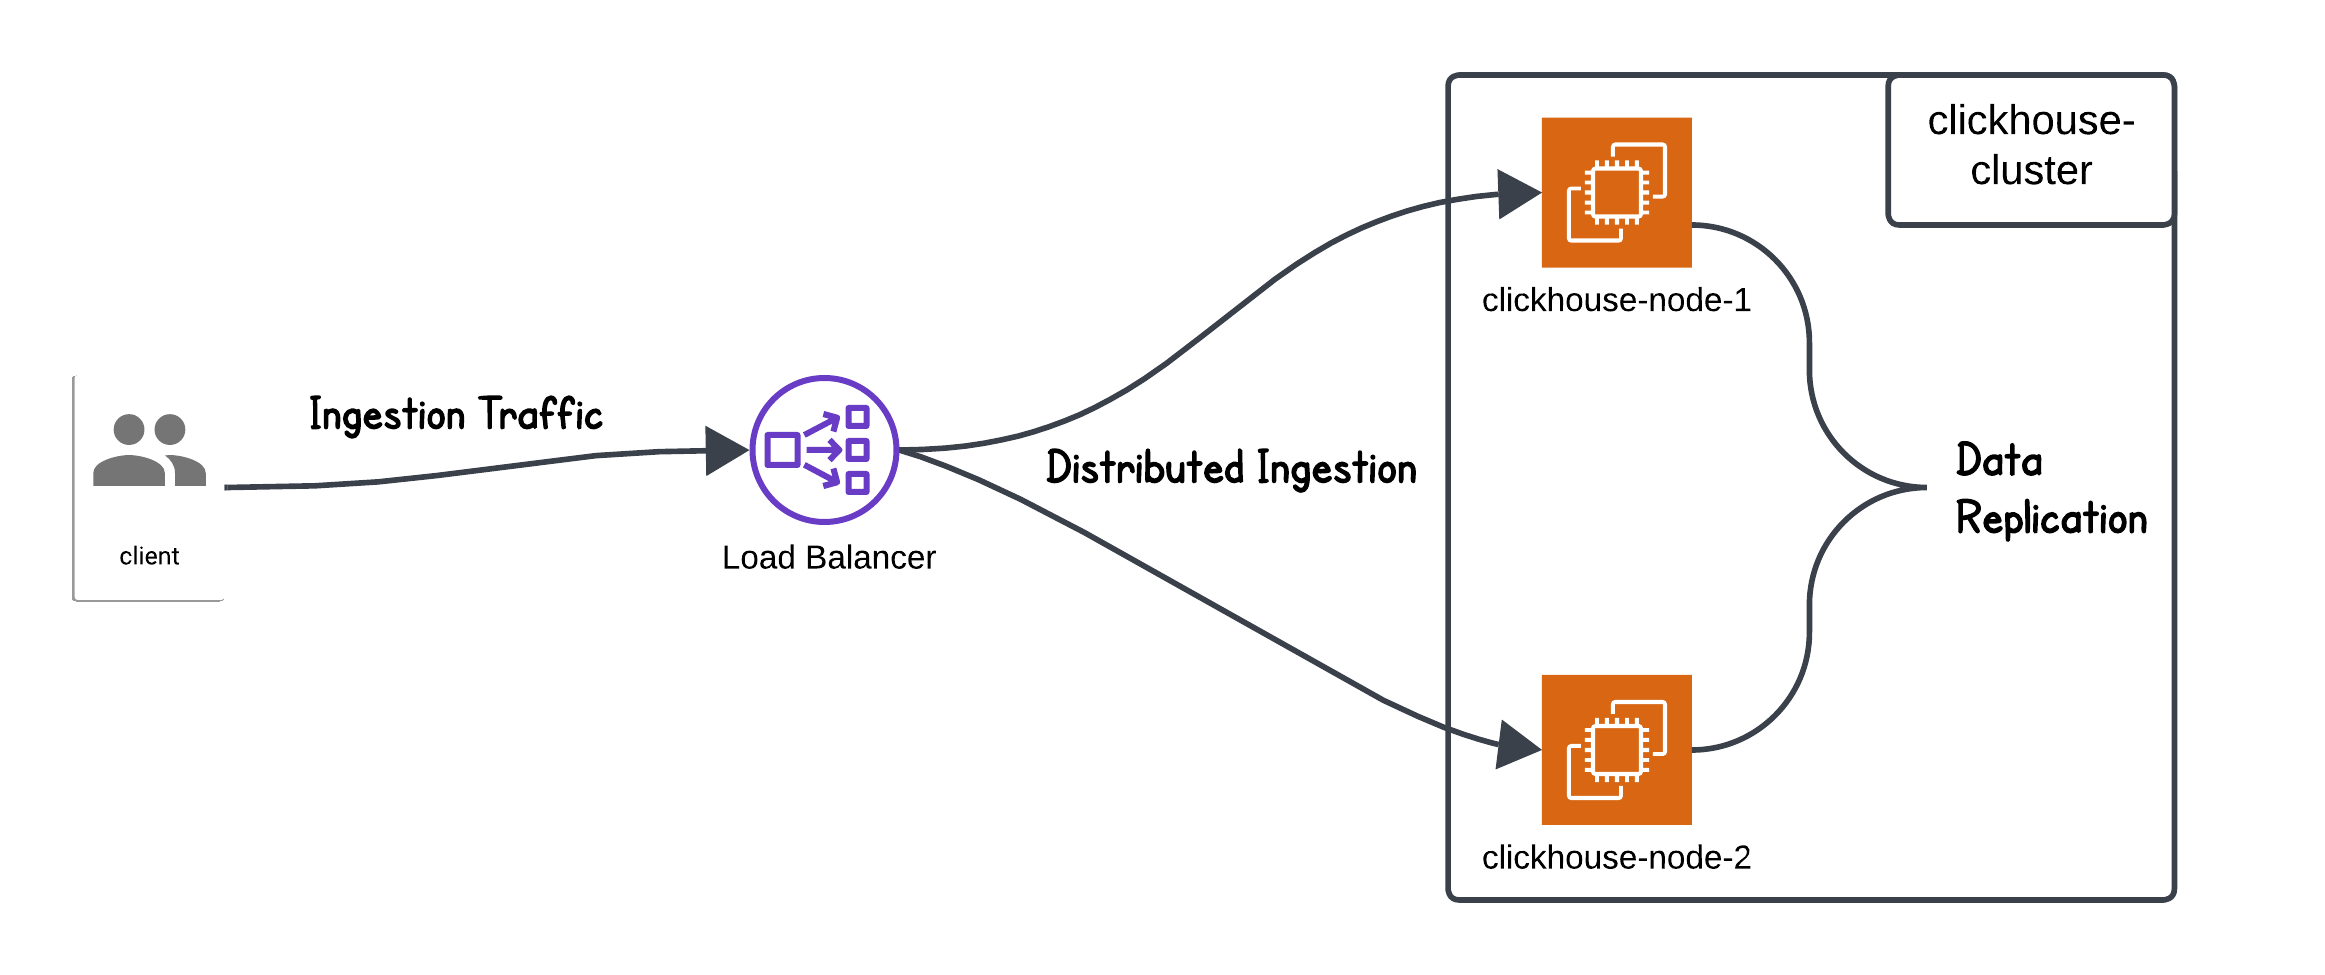
For setting up the ClickHouse cluster, we followed the ClickHouse replication architecture guide and the AWS CloudFormation ClickHouse cluster setup. Using these resources, we replicated the setup on ECS, allowing us to run performance benchmarking tests on the environment.
For this benchmarking, we deployed ClickHouse version
24.3.12.75for bothclickhouse-serverandclickhouse-keeper. Our ECS cluster configuration included a fault-tolerant setup with1 shard and 2 replicas, composed of2 ClickHouse server nodesand3 ClickHouse Keeper nodes. Each node was provisioned onm5.xlargeinstances, ensuring the necessary resources to handle our high-ingestion and query-intensive workloads.
By examining performance metrics during the ingestion of 1 million, 5 million, 10 million, and 66 million logs, we aim to provide a quantitative analysis of how system behavior changes as the load increases.
For more details on the schema and test queries used, you can download the SQL file here.
Performance Comparison of Key Metrics Across Ingestion Volumes
Logs Ingested |
CPU Usage (Cores) |
Selected Bytes per Second (MB/s) |
IO Wait (s) |
CPU Wait (s) |
Read from Disk (MB) |
Read from Filesystem (MB) |
Memory Tracked (MB) |
Selected Rows per Second |
Inserted Rows per Second |
|---|---|---|---|---|---|---|---|---|---|
1 Million (10 Lakh) |
0.103 | 0.026 | 0.000 | 0.0217 | 0.000 | 0.42 | 714 | 256.88 | 238,666.67 |
5 Million (50 Lakh) |
0.111 | 0.036 | 0.000 | 0.0058 | 0.000 | 0.51 | 738 | 256.88 | 238,666.67 |
10 Million (1 Crore) |
0.433 | 36.26 | 0.000 | 0.3297 | 1.84 | 3.17 | 983 | 146,848.98 | 140,193.58 |
66 Million (6.6 Crore) |
1.179 | 122 | 0.750 | 4.4276 | 17.33 | 13.63 | 1,971 | 365,589.00 | 365,589.00 |
Key Insights from the Data
1. CPU Usage (avg_cpu_usage_cores)
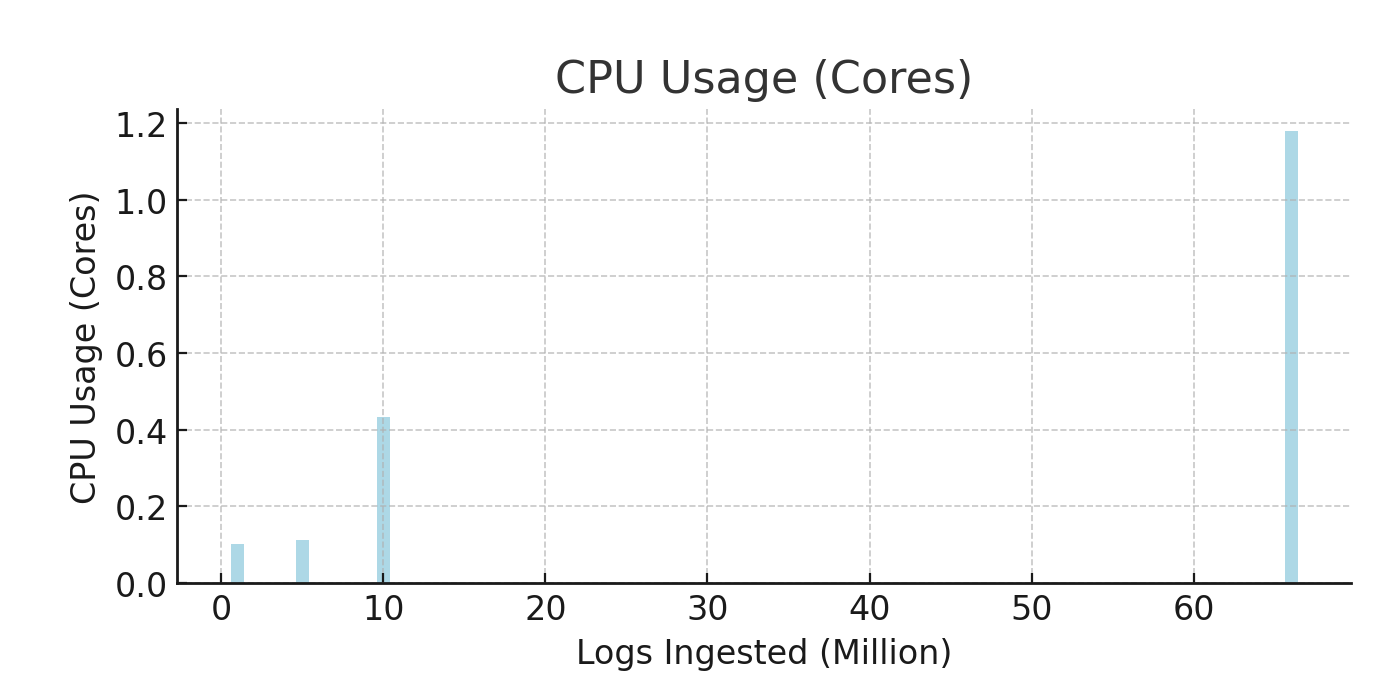
- At
1 million logs, CPU usage was low, increasing slightly with5 million logs, reflecting an8%rise. - At
10 million logs, CPU usage jumped by290%, showing significant processing demand. - At
66 million logs, CPU surged by173%over the previous level, indicating much higher CPU load as ingestion scaled.
2. Selected Bytes per Second (avg_selected_bytes_per_second)
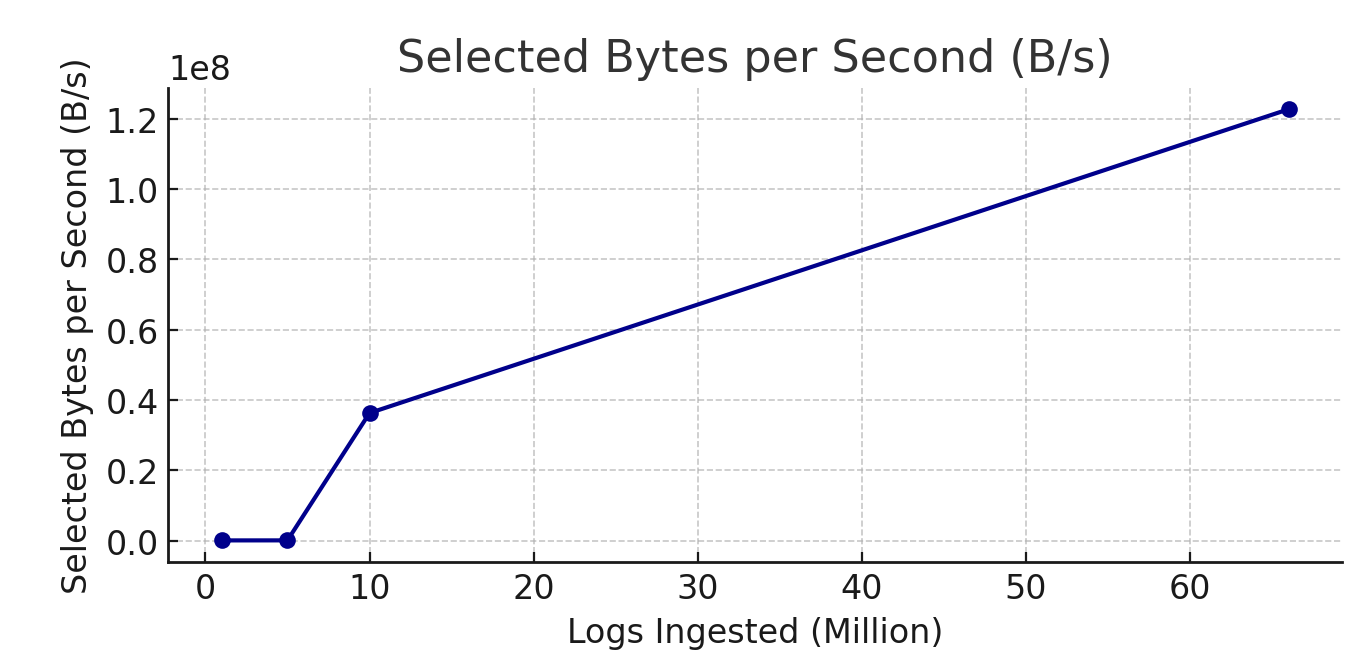
- For
1 million logs, throughput was0.026 MB/sec, increasing to0.036 MB/secfor5 million logs, a38%increase. - At
10 million logs, throughput reached36.26 MB/sec, up1000%from5 million logs. - At
66 million logs, throughput hit122 MB/sec, a3.4xincrease, demonstrating strong scalability.
3. I/O Wait (avg_io_wait)
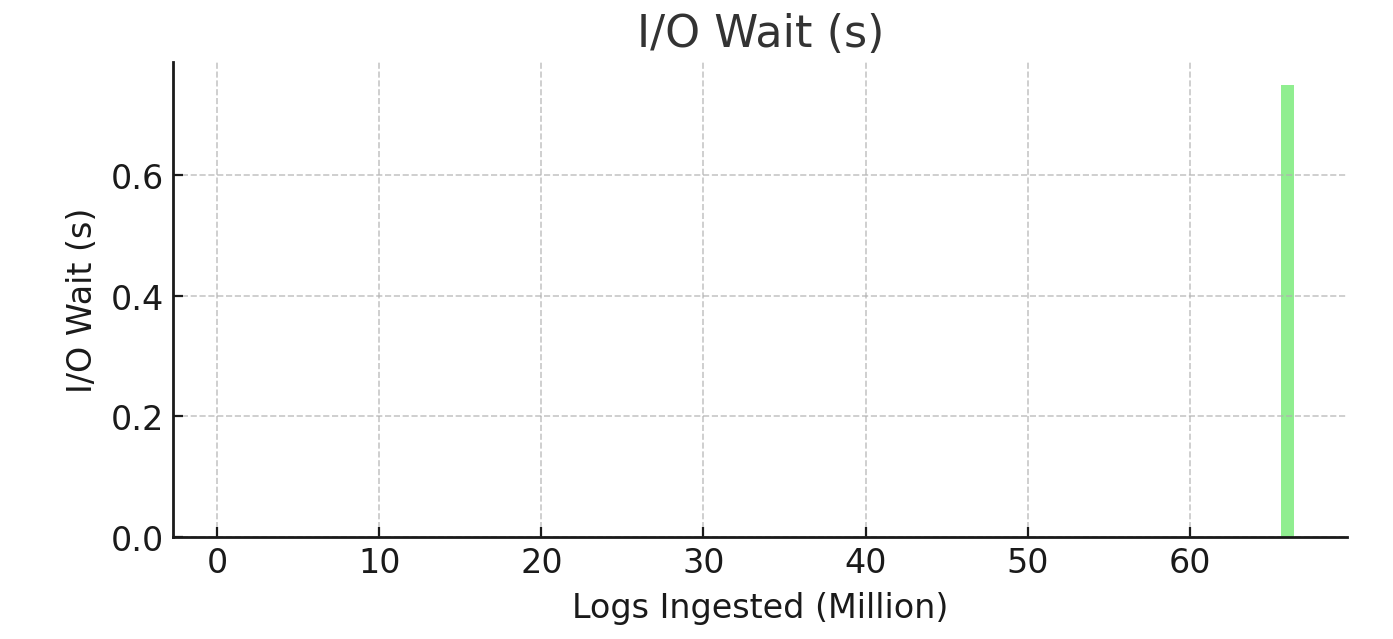
I/O waitwas negligible at1and5 million logswith0 seconds.- For
66 million logs,I/O waitspiked to0.75 seconds, a notable bottleneck as ingestion volume increased.
4. CPU Wait (avg_cpu_wait)
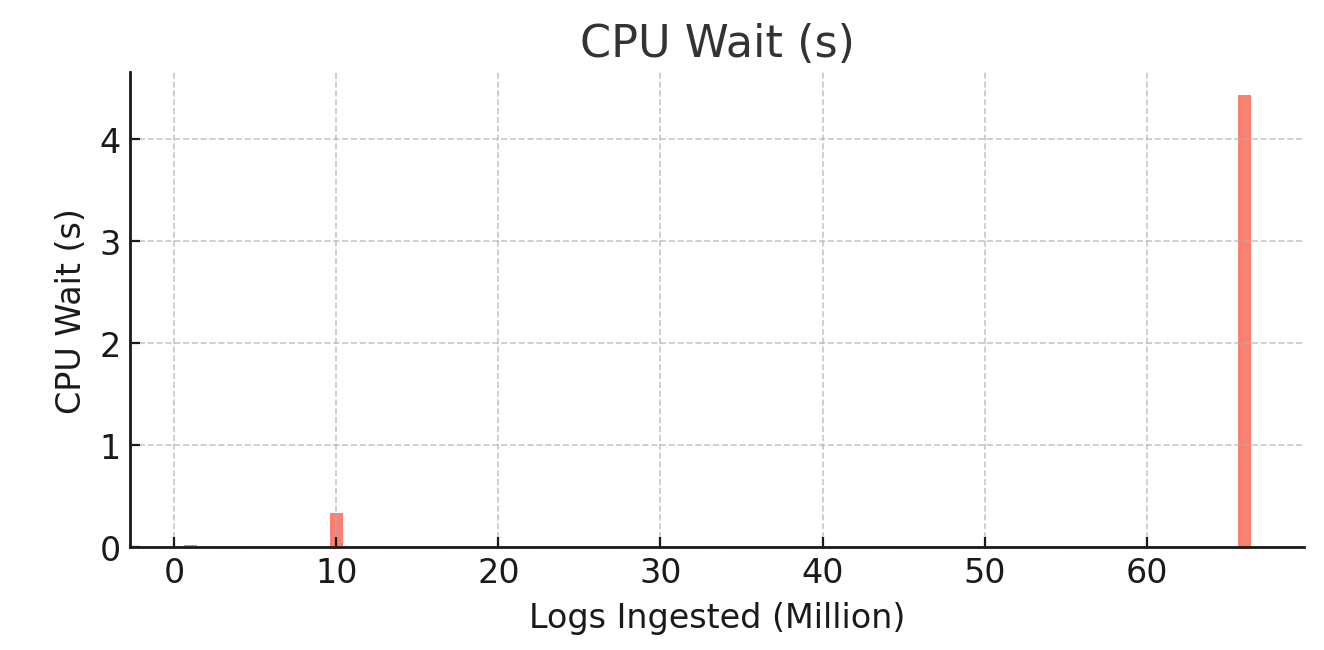
CPU wait timewas0.0217 secondsfor1 million logs, decreasing to0.0058 secondsfor5 million logs, a73%improvement.- At
10 million logs, it rose to0.3297 seconds, a56xincrease. - At
66 million logs, CPU wait reached4.4276 seconds, reflecting high contention for CPU.
5. Disk Reads (avg_read_from_disk)
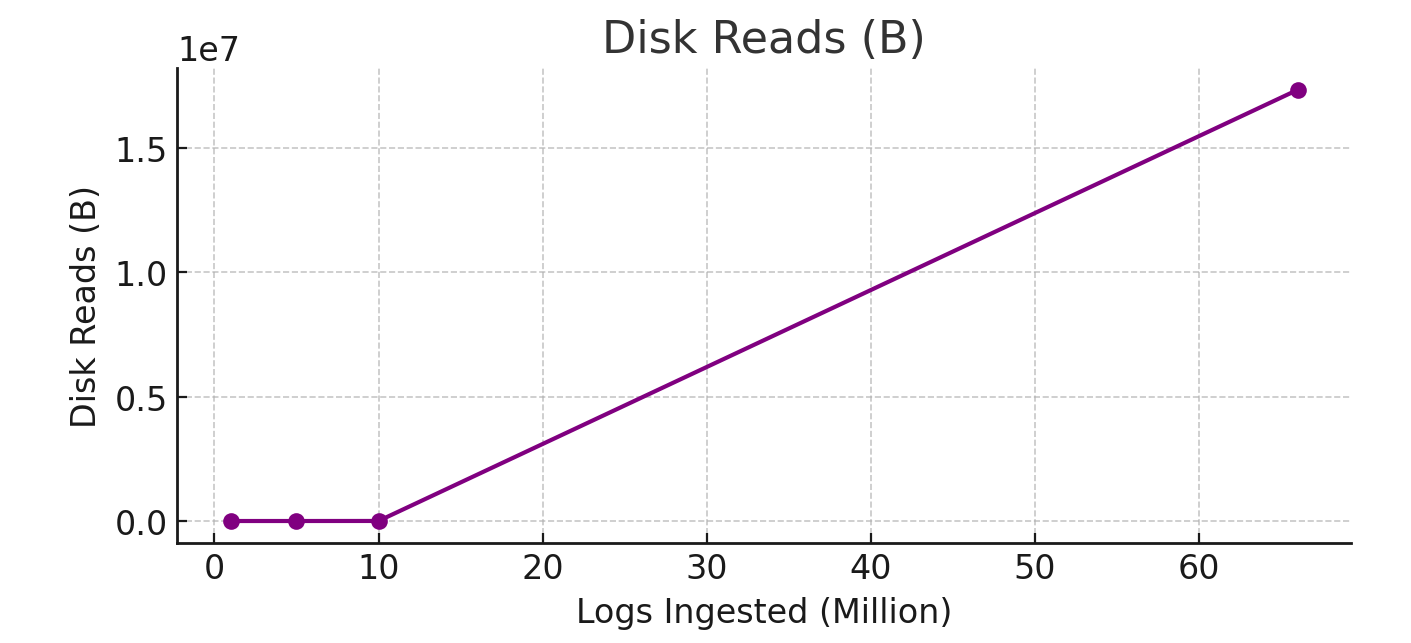
- Disk reads were
0 bytesat1and5 million logs. - At
10 million logs, disk reads spiked to1.843 MB, and at66 million logs, they rose to17.33 MB, showing a10xincrease.
6. Filesystem Reads (avg_read_from_filesystem)
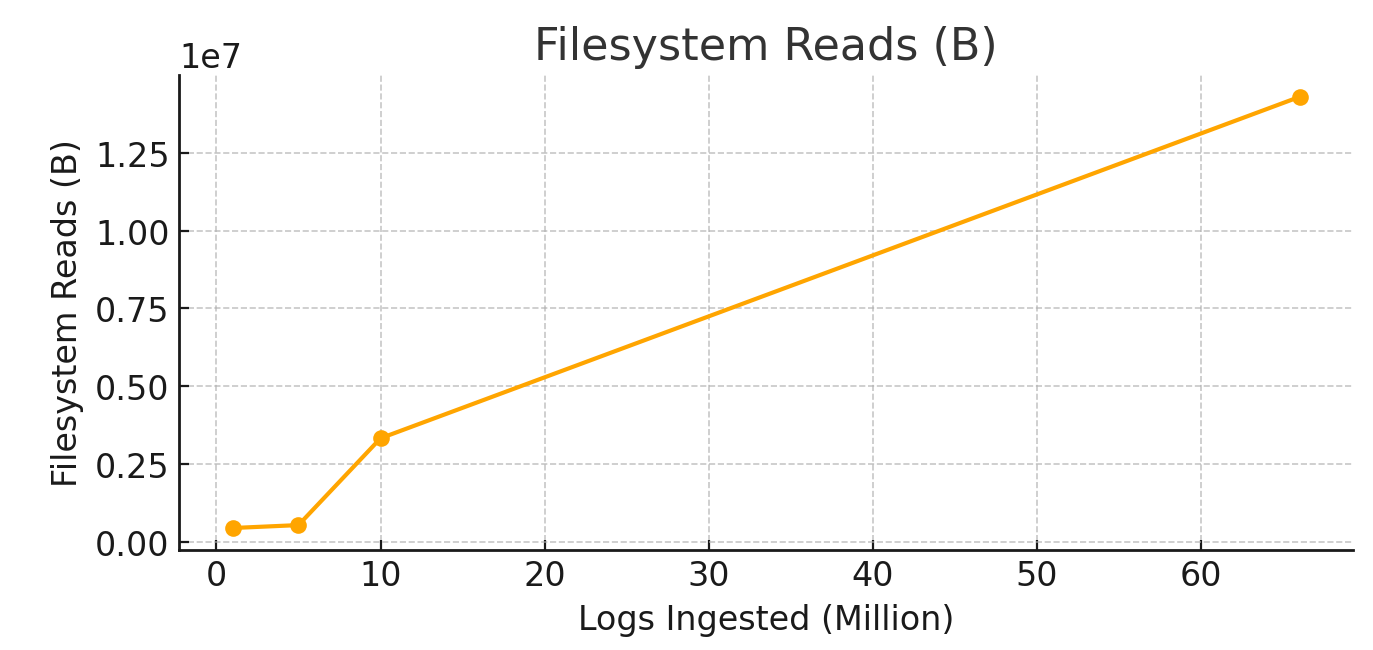
- Filesystem reads began at
0.42 MBfor1 million logs, rising to0.51 MBfor5 million logs, a21%increase. - At
10 million logs, it jumped to3.17 MB, a5xincrease. - At
66 million logs, filesystem reads reached13.63 MB, a4.3xincrease from the previous level.
7. Memory Usage (avg_memory_tracked)
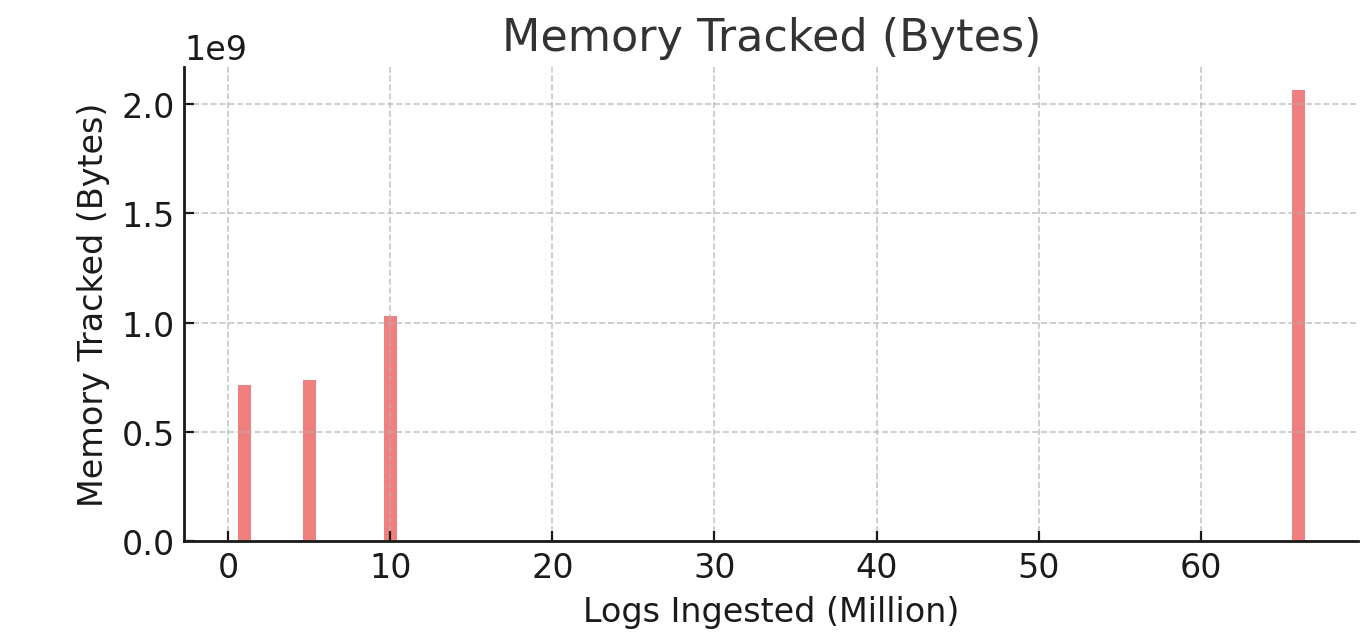
- Memory usage was
714 MBfor1 million logs, increasing to738 MBfor5 million logs, a3%rise. - At
10 million logs, memory usage reached983 MB, a36%increase. - At
66 million logs, it peaked at1.9 GB, a doubling from10 million logs.
8. Selected Rows per Second (avg_selected_rows_per_second)
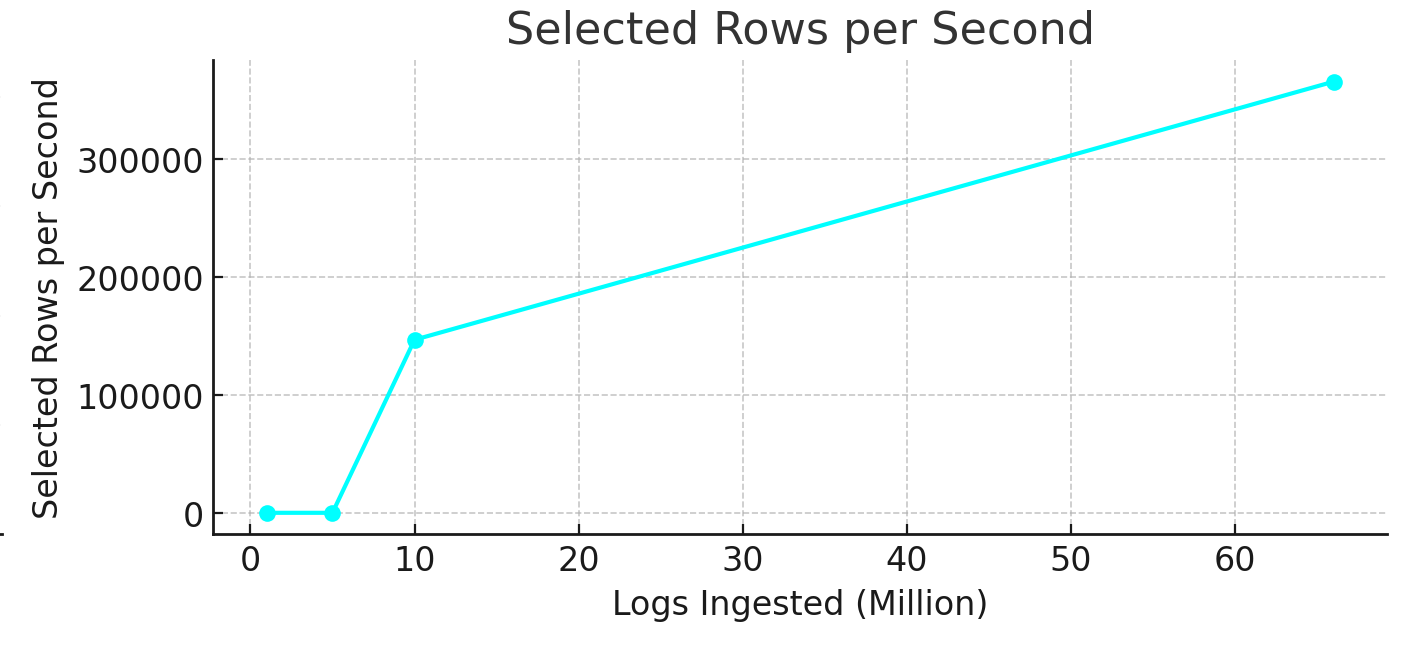
- At
1and5 million logs,256 rows/secwere selected. - At
10 million logs, selected rows per second rose to146,849 rows/sec, a570xincrease. - At
66 million logs, selected rows reached365,589 rows/sec, a2.5xrise over10 million logs.
9. Inserted Rows per Second (avg_inserted_rows_per_second)
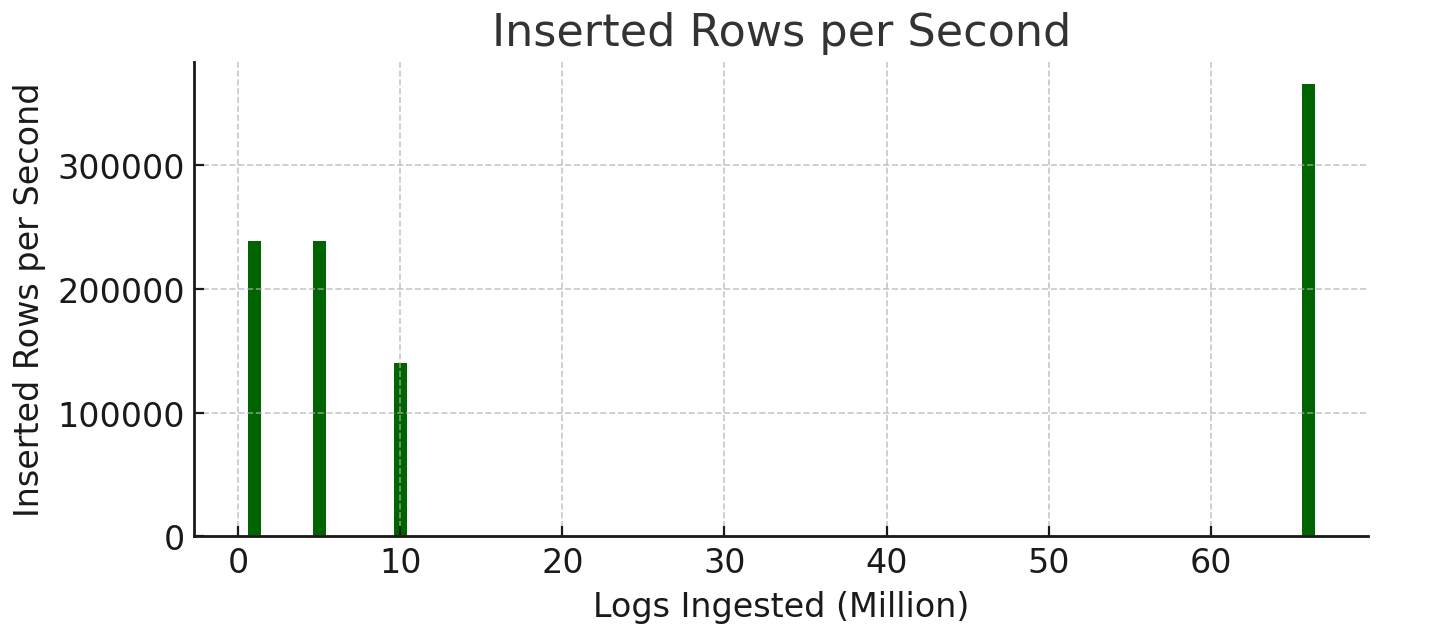
- Inserted rows per second were consistent at
238,666 rows/secfor1and5 million logs. - At
10 million logs, the insertion rate was140,193 rows/sec, a41%increase. - At
66 million logs, it rose to365,589 rows/sec, reflecting efficient scaling for high ingestion volumes.
Performance in Read-Heavy Operations
ClickHouse’s performance during read-heavy operations, including SELECT, aggregate, and JOIN queries, is critical for applications relying on fast data retrieval. Here, we analyze key system metrics across different configurations: two-node replicas under load balancing and a single-node configuration due to failover.
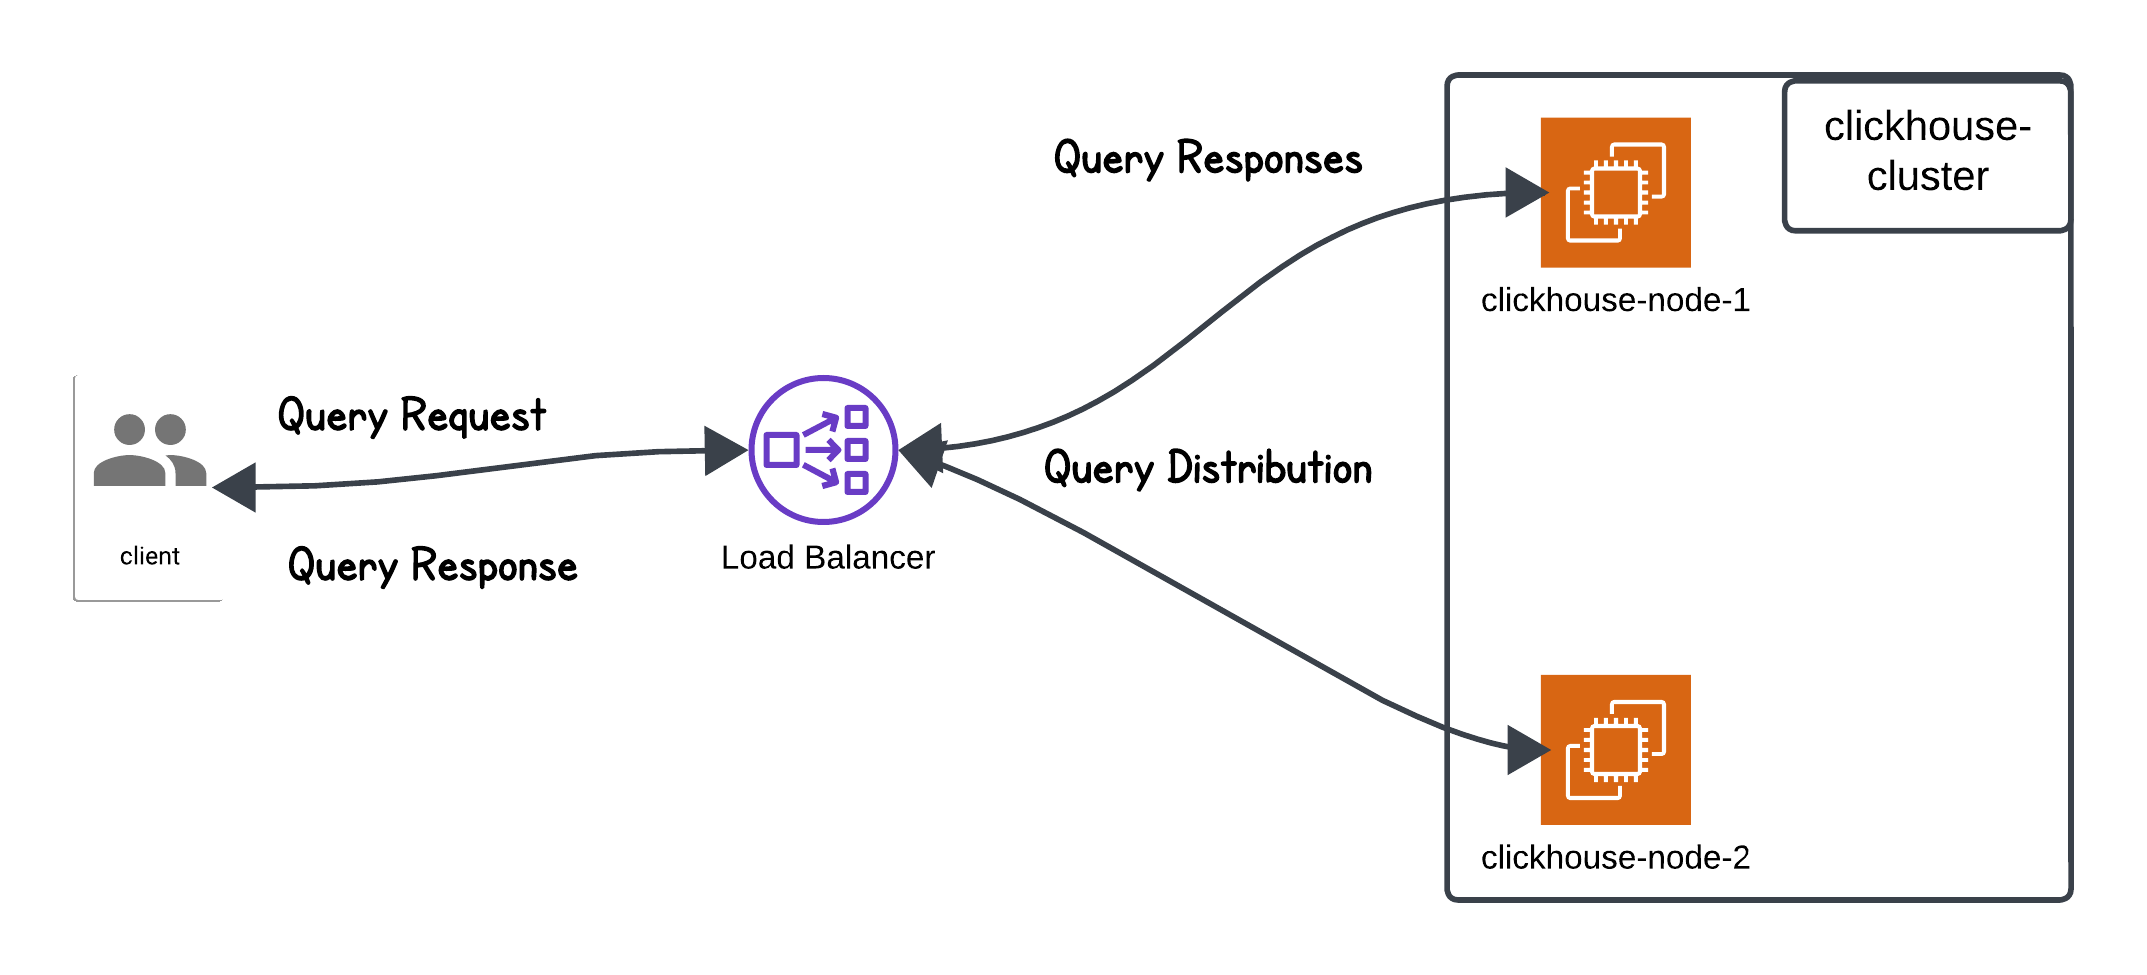
Performance Comparison of Key Metrics Across Configurations
Configuration |
CPU Usage (milli-cores) |
Selected Bytes per Second (MB/s) |
IO Wait (milli-seconds) |
CPU Wait (s) |
Read from Disk (MB) |
Read from Filesystem (MB) |
Memory Tracked (MB) |
Selected Rows per Second |
Inserted Rows per Second |
|---|---|---|---|---|---|---|---|---|---|
Two Nodes (Node-1) |
574 – 875 | 143 – 224 | 0.2 – 7.7 | 1.045 – 1.9356 | 13 – 21 | 14 – 22 | 694 – 912 | 412,713.28 – 648,431.85 | 246.08 – 2,006 |
Two Nodes (Node-2) |
122 – 493 | 0.022 - 80 | 4.7 | 1.0964 – 0.0039 | 0 – 7 | 1 - 8 | 781 – 692 | 232,168.82 – 238.1 | 253.93 – 238.1 |
Single Node (Node-2 Down) |
529 – 883 | 158 – 283 | 0.2 | 1.8338 – 9.1992 | 3 – 11 | 30 – 32 | 837 – 861 | 458,760 – 9,742,907.23 | 214.92 – 222.00 |
Key Performance Insights from System Metrics
1. CPU Usage (avg_cpu_usage_cores)
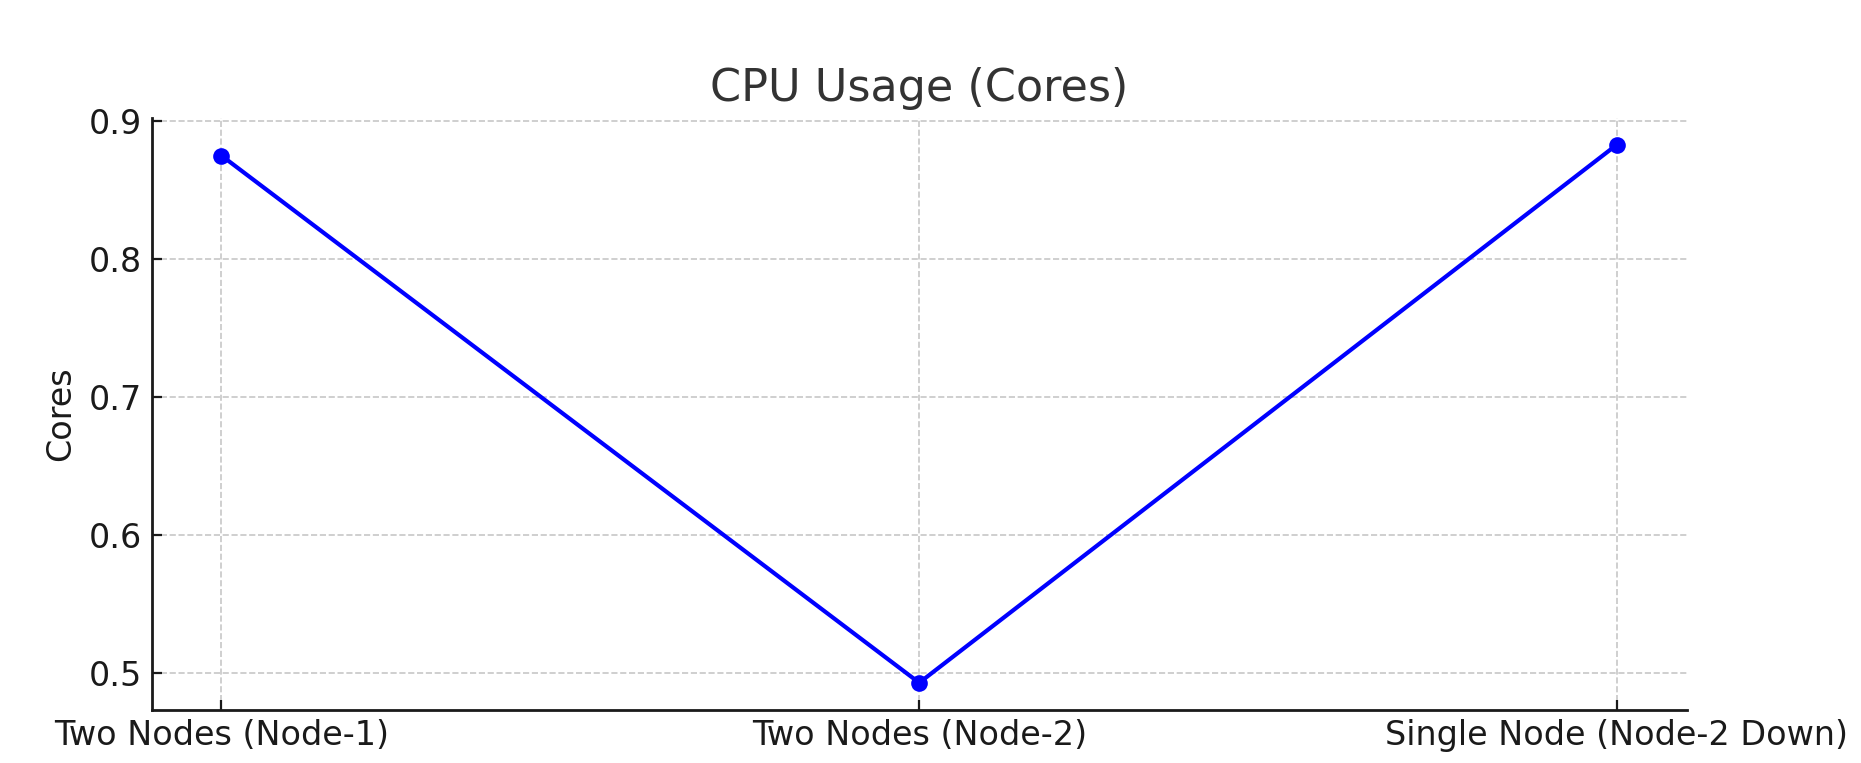
Two-Node Setup: Node-1 utilized between574 to 875 milli-coresduring query processing, handling most of the workload. Node-2 had lower CPU usage, ranging from122 to 493 milli-cores, indicating that load distribution wasn’t entirely balanced across nodes.Single-Node Setup: CPU usage ranged from529 to 883 milli-coresas it handled all queries independently, highlighting increased CPU demands without load balancing.
2. Selected Bytes per Second (avg_selected_bytes_per_second)
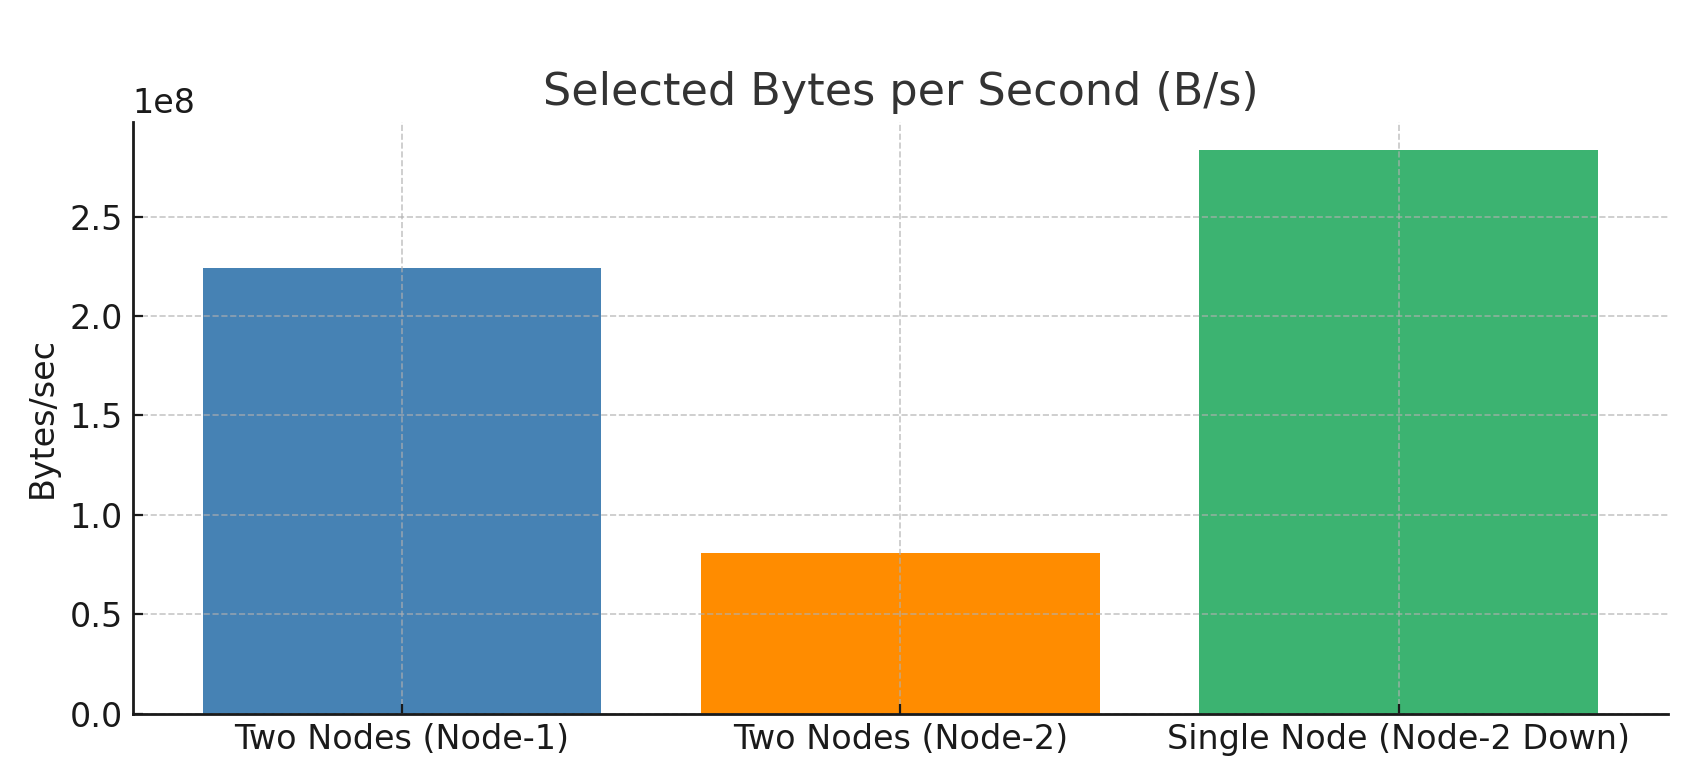
Two-Node Setup: Node-1 processed data at speeds between143 MB/s to 224 MB/s, while Node-2 managed much lower speeds, ranging from22 KB/s to 80 MB/s, showing an uneven data split.Single-Node Setup: Data selection rates reached158 MB/s to 283 MB/s, indicating strong throughput even with just one node handling queries.
3. I/O Wait (avg_io_wait)
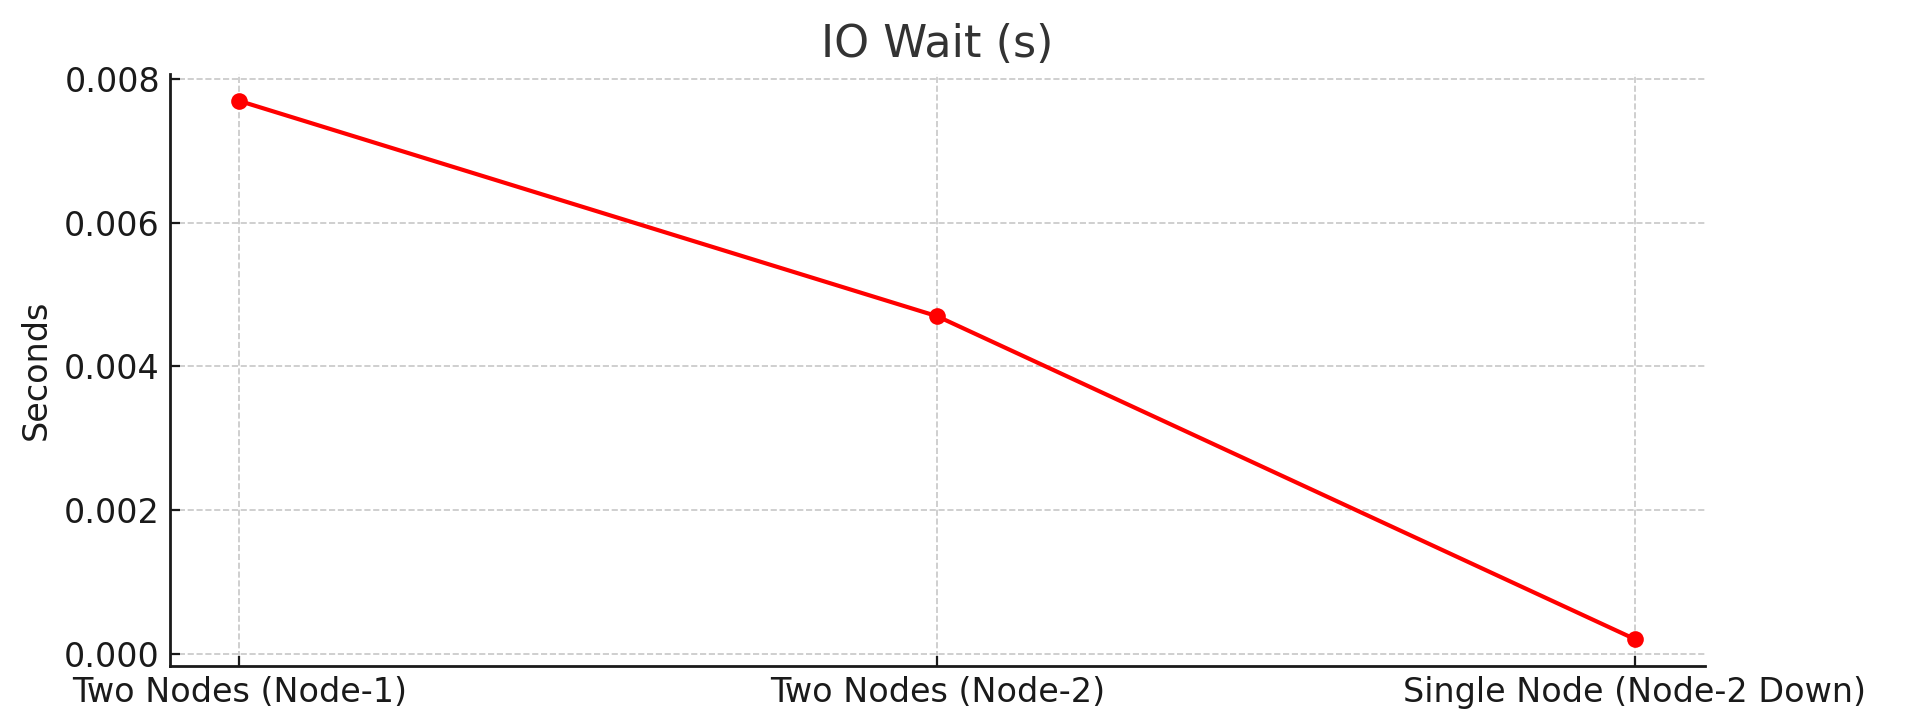
Two-Node Setup: I/O wait times were minimal, with Node-1 recording only0.2 to 7.7 milliseconds, and Node-2’s wait times was4.7 milliseconds.Single-Node Setup: Maintained efficient I/O performance, with an I/O wait of0.2 milliseconds, even under higher loads.
4. CPU Wait (avg_cpu_wait)
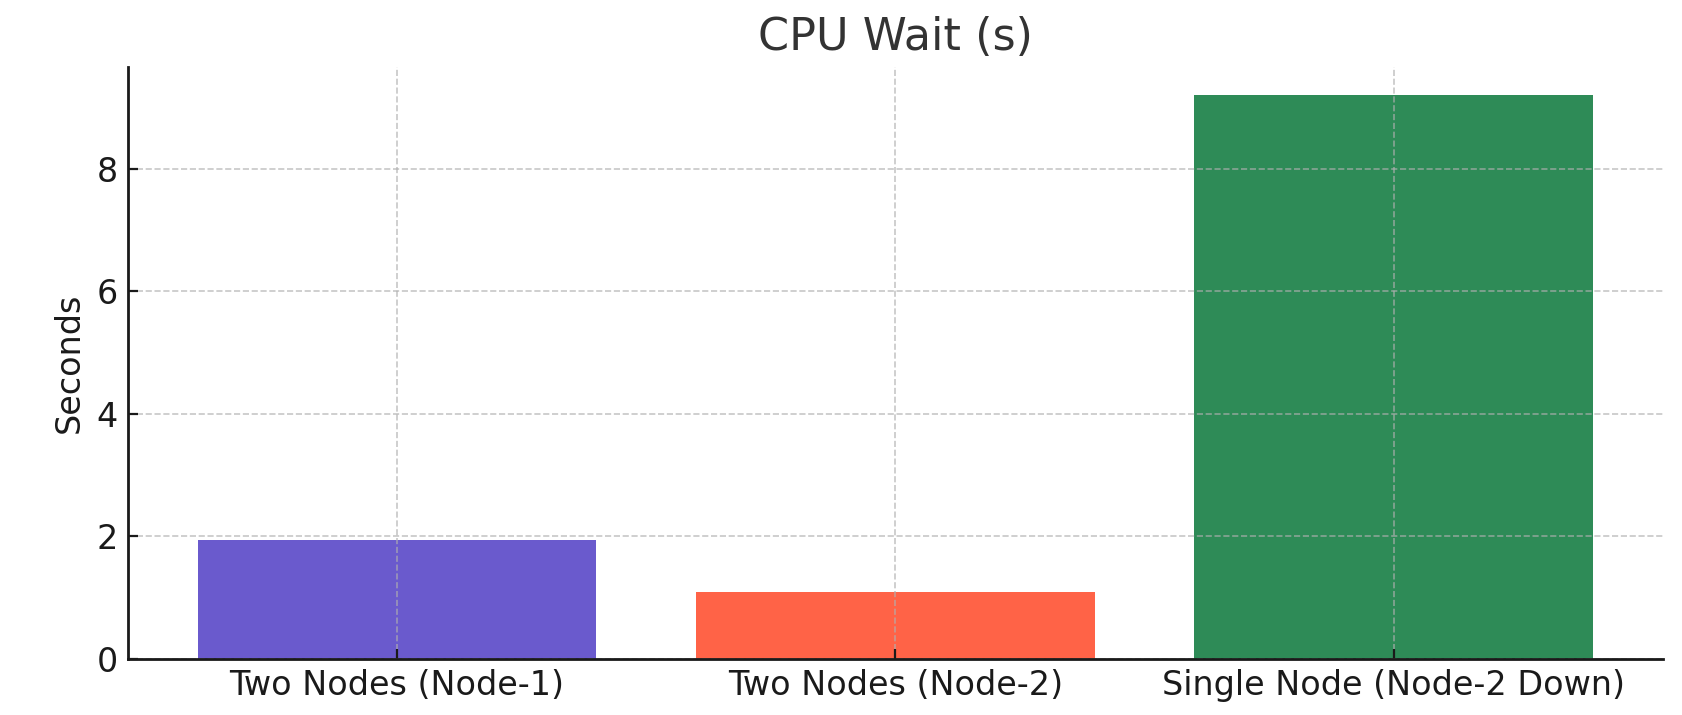
Two-Node Setup: Node-1’s CPU wait time was low, peaking at1.94 secondsduring complex queries.Single-Node Setup: CPU wait times were significantly higher, ranging from1.8 to 9.2 seconds, showing CPU contention under a high query load when only one node was active.
5. Disk Reads (avg_read_from_disk)
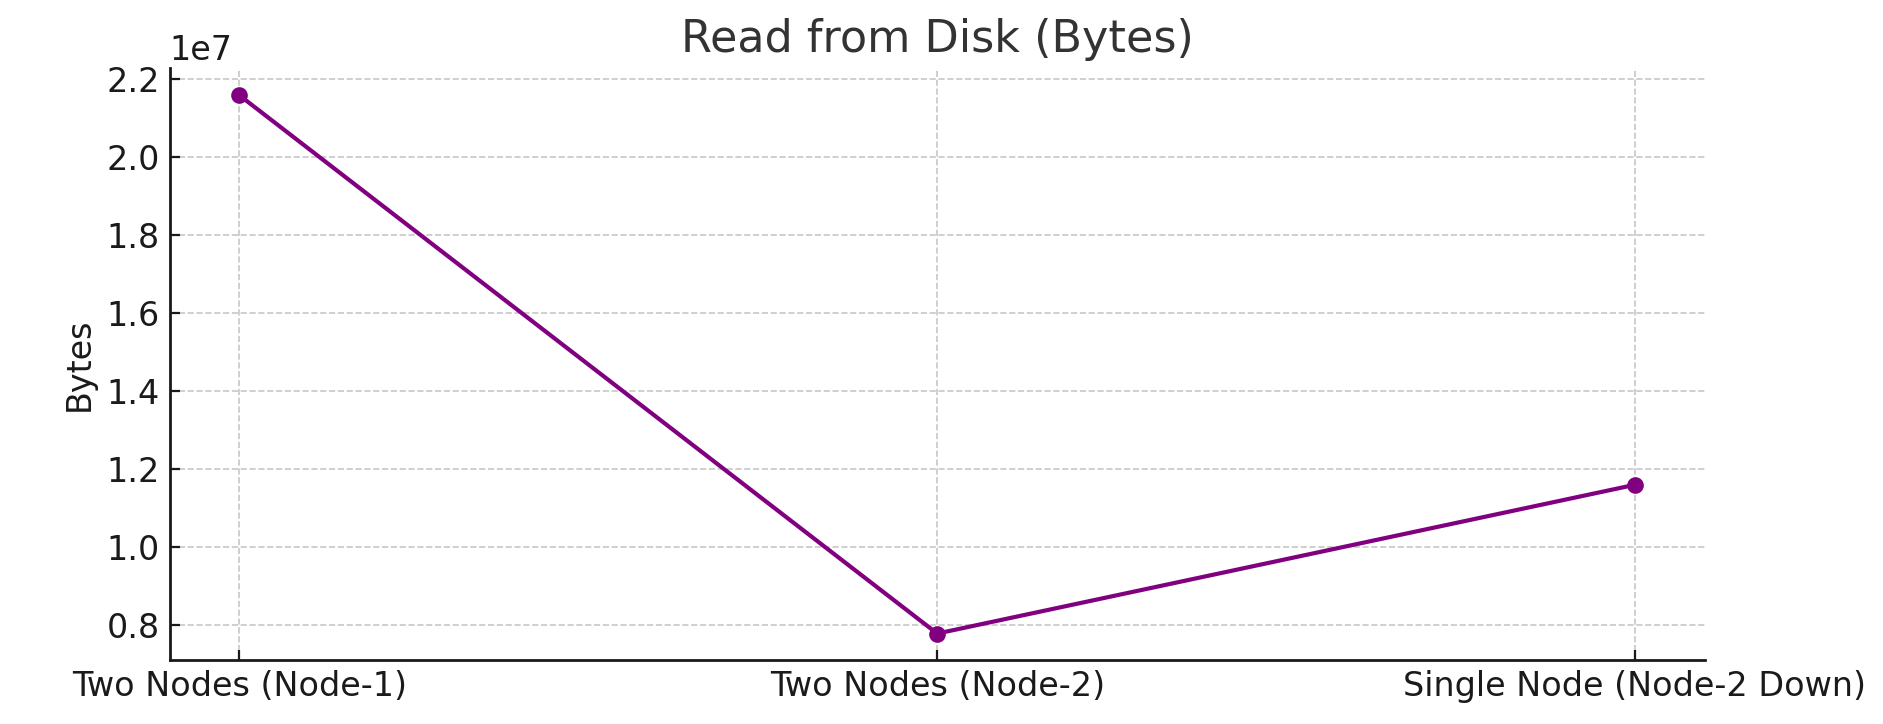
Two-Node Setup: Disk reads on Node-1 ranged between13 MB and 21 MB, while Node-2 saw reduced reads (0 to 7 MB).Single-Node Setup: Disk reads increased to3 MB to 11 MB, reflecting the added reliance on disk I/O without load balancing.
6. Filesystem Reads (avg_read_from_filesystem)
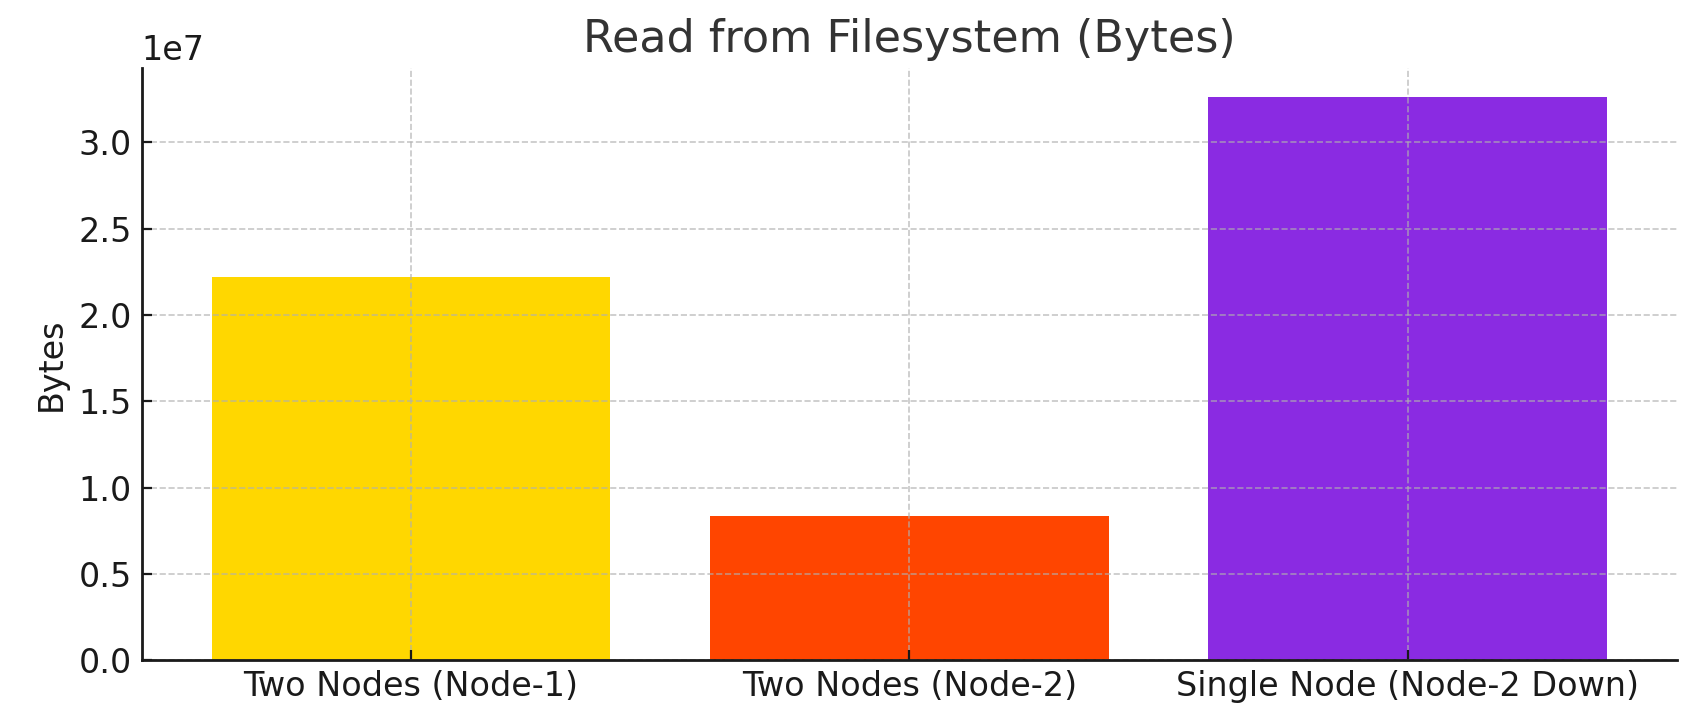
Two-Node Setup: Node-1 had filesystem reads ranging from14 MB to 22 MB.Single-Node Setup: Reads increased to30 MB to 32 MB, illustrating higher filesystem demand with all queries processed on one node.
7. Memory Usage (avg_memory_tracked)
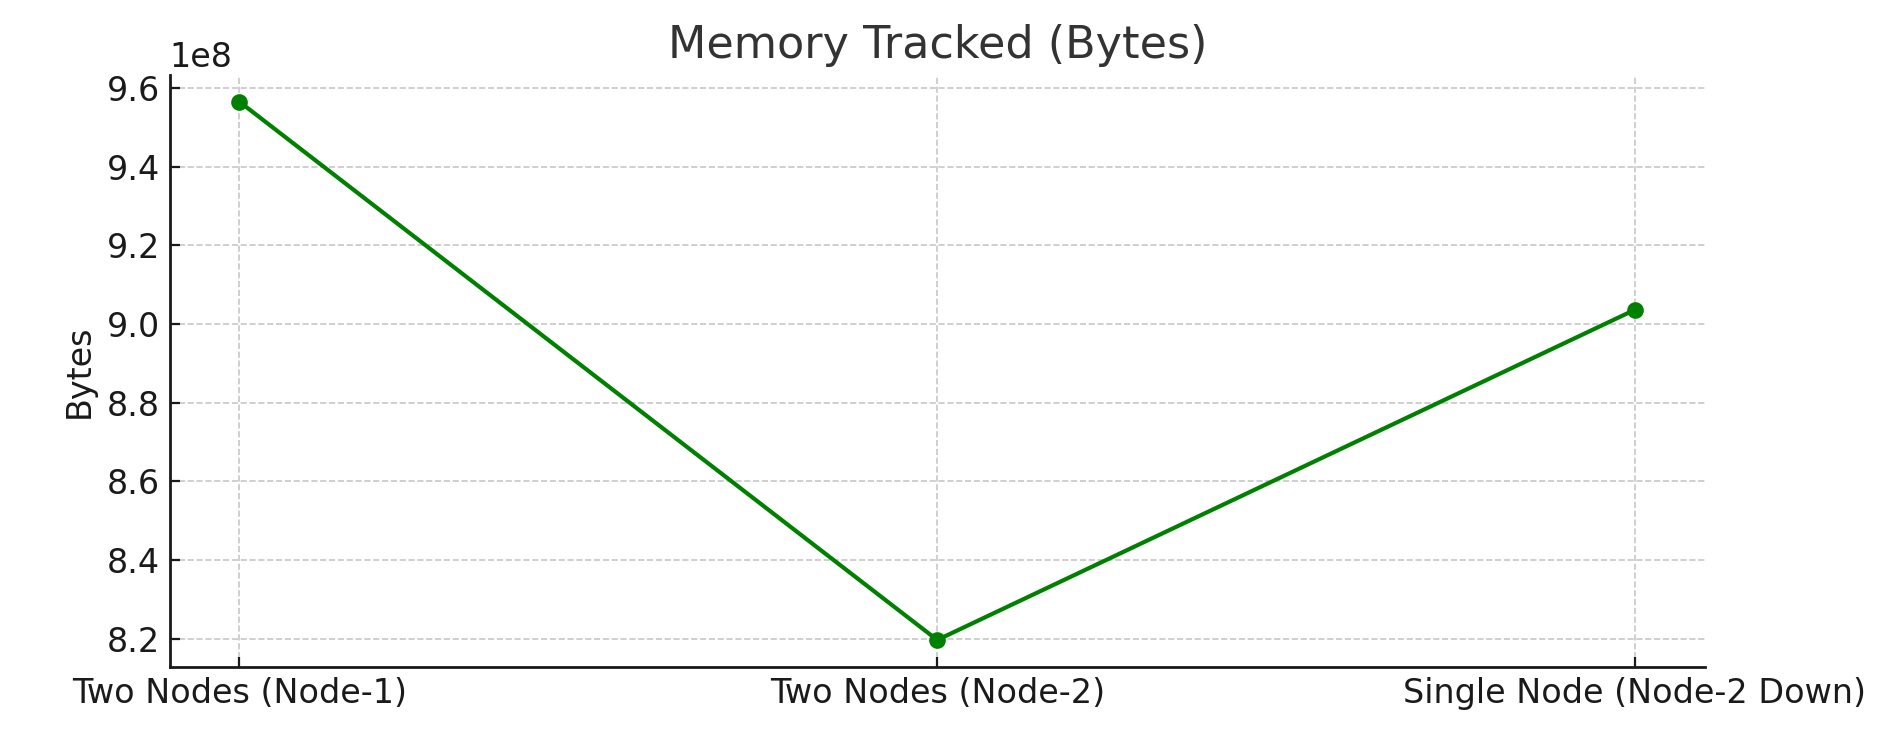
Two-Node Setup: Node-1’s memory usage ranged from694 MB – 912 MB.Single-Node Setup: Memory usage rose slightly to831 MB to 861 MB, reflecting the additional memory load for standalone query handling.
8. Selected Rows per Second (avg_selected_rows_per_second)
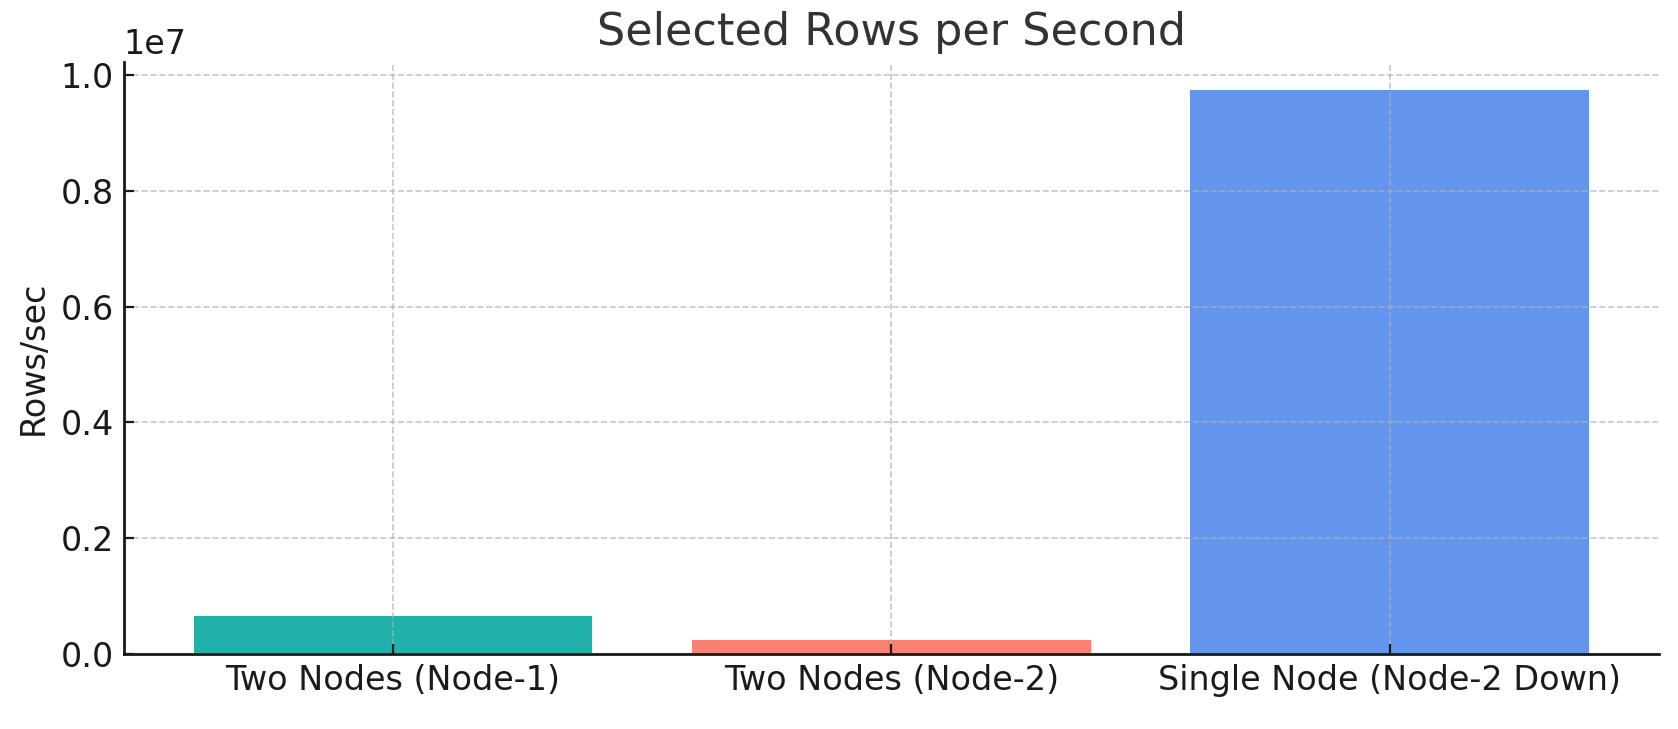
Two-Node Setup: Node-1 retrieved data at412,000 to 648,000 rows per second, while Node-2 retrieved232,000 to 238,000 rows per second.Single-Node Setup: Retrieval rate spiked to9.7 million rows per second, demonstrating the node’s capacity to handle increased retrieval demands on its own.
9. Inserted Rows per Second (avg_inserted_rows_per_second)
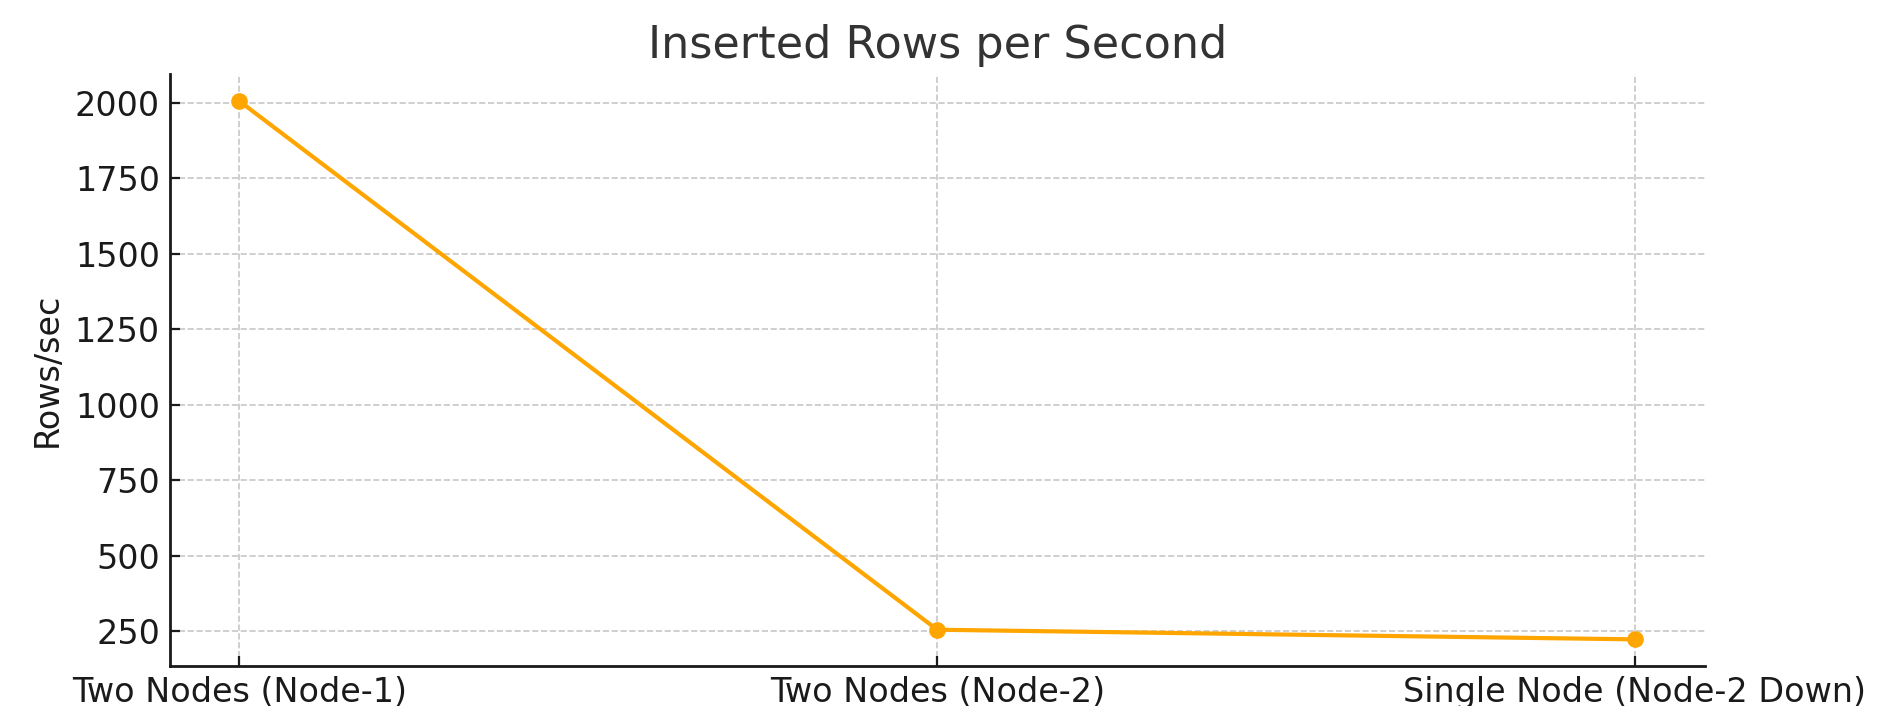
Two-Node Setup: Node-1 showed stable insertion rates at246 to 2,006 rows per second, while Node-2 remained consistent at254 to 238 rows per second.Single-Node Setup: Insertion rates remained consistent at215 to 222 rows per second, suggesting that query load minimally affected insertion performance when only one node was handling the workload.
Conclusion
This benchmarking study highlights ClickHouse’s ability to handle both high-ingestion and read-intensive workloads on ECS. For ingestion, ClickHouse efficiently managed small data loads, but higher volumes (10M and 66M logs) led to significant increases in CPU, memory, and I/O wait, indicating the need for resource scaling.
For read operations, a two-node setup provided balanced CPU and I/O distribution, while a single-node setup led to increased CPU wait and resource contention under full query load.
To optimize performance, monitoring key metrics like CPU usage, I/O wait, and memory is essential, and leveraging multi-node configurations can help maintain efficient performance under heavy workloads.


